
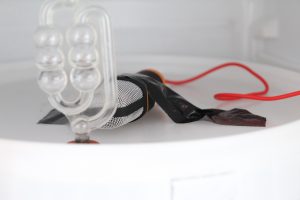
I developed a very simplistic algorithm to detect bubbles via audio from an airlock during fermentation. The airlock is simply filled with water, which makes bubbles and therefore bubble sounds, when CO2 passes through.
You can see in this image, I simply used a cheap microphone attached to a laptop to record audio from the airlock.
I wrote a simple bash script, which makes use of ‘sox’ to record the audio, it splits the audio into hourly chunks, which makes processing later easier.
#!/bin/bash

# log start time
date > start

# record in hourly chunks
SEC=`expr 60 \* 60`
echo $SEC

# start recording
sox -d bubbles_.wav channels 1 rate 48k trim 0 $SEC : newfile : restart</pre>
In order for matplotlib to generate the correct dates for me, I created the following file:
.config/matplotlib/matplotlibrc
backend      : Qt5Agg
timezone     : Europe/London
FFT Method
I took a very simplistic method to detect bubbles, by taking the FFT of chunks of audio and obtaining magnitudes from this.
For each FFT, if there are N peaks above a certain magnitude, the chunk is simply classed as a bubble. Since the microphone is inside a fridge, next to the airlock, this cancels external noises reasonably well I think.
You can see in this video, the FFT output in the top graph, and in the bottom graph, whether we class something as a bubble or not.
Raw data
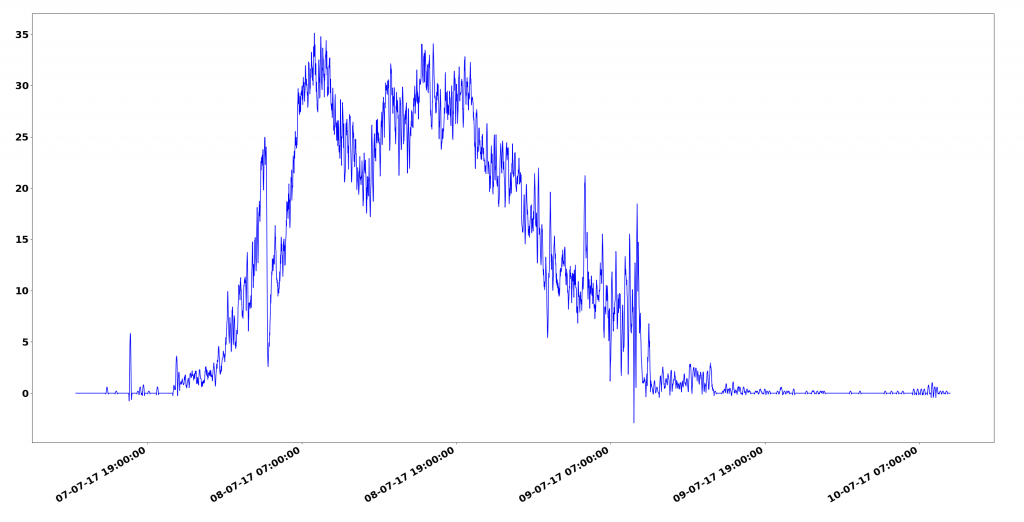
This graph depicts the bubbles per minute against time.
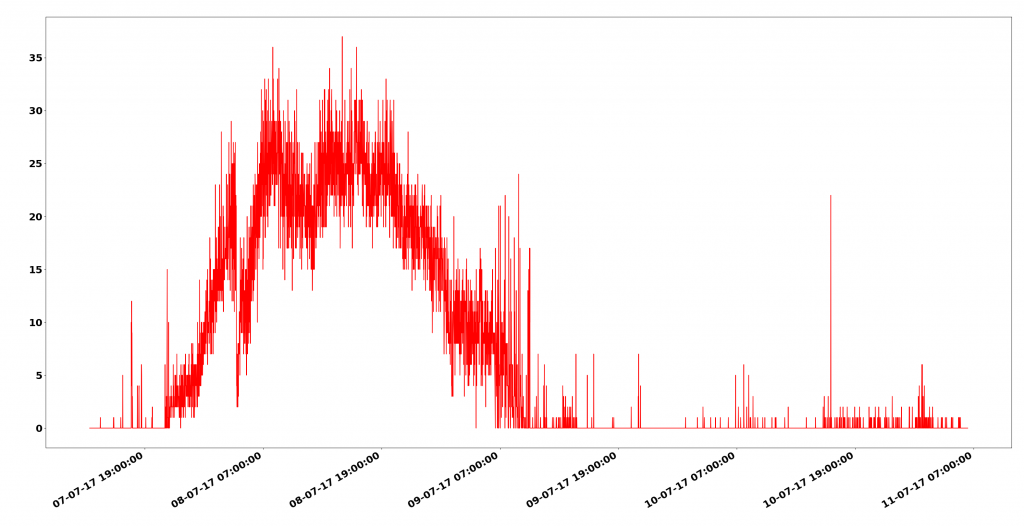
Line of best fit using Savitzky-Golay filter from FFT approach
Envelope Method
I also created another method making use of first a bandpass filter to filter ideally for bubble sounds between 800 and 3000 Hz.
Then a low pass filter was applied to create a signal envelope.
Chunks of 512 samples at a time were obtained from this envelope. The 512 sample envelope was integrated using the numpy function ‘trapz’, to find the area under the envelope. If the area is above a certain threshold it is classed as a bubble.
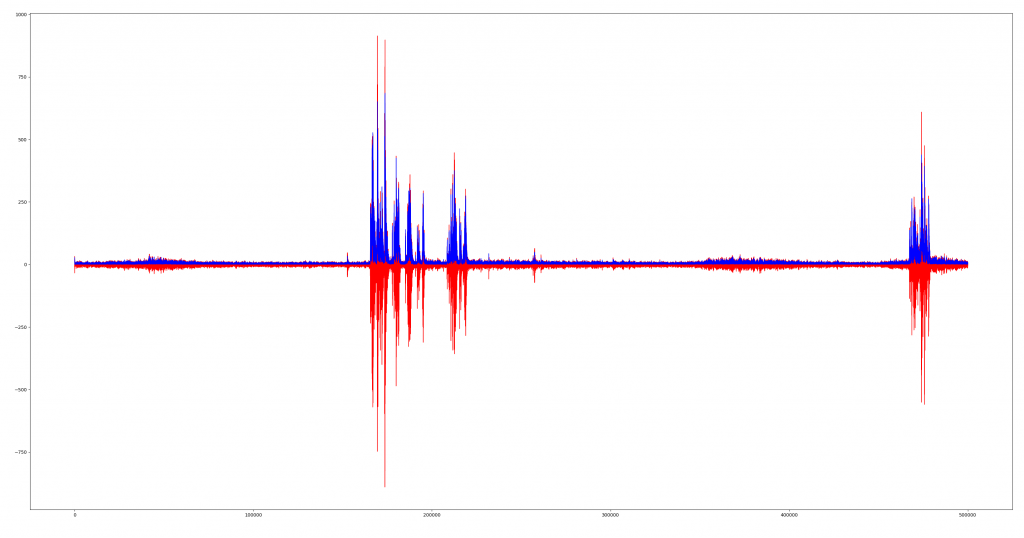
The following image depicts the envelope obtained from the audio file with bubbles in. The red line represents the waveform after the bandpass has been applied. While the blue line represents the envelope obtained from the low pass filter.
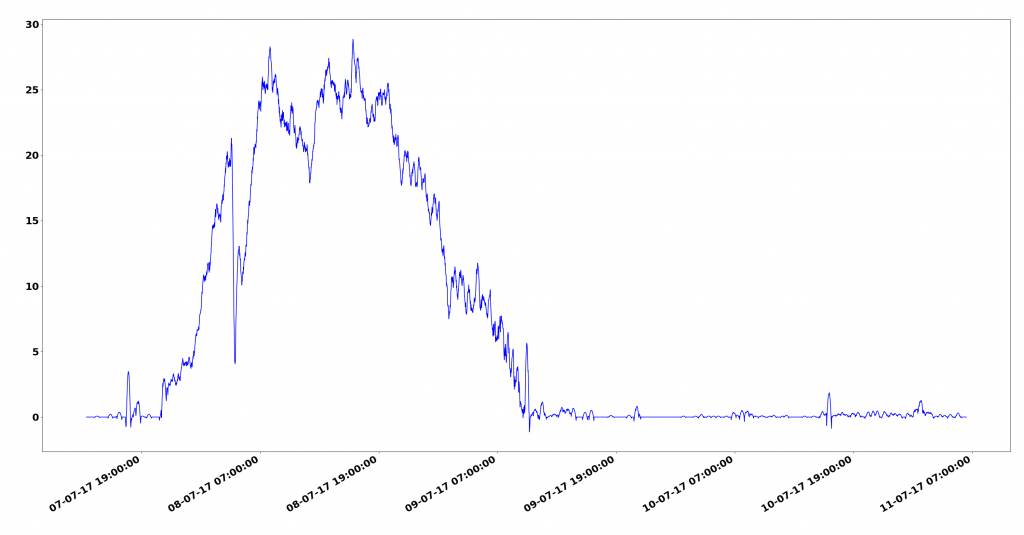
Line of best fit using Savitzky-Golay filter from envelope approach
You will notice the bubble counts aren’t exactly the same as the FFT method, due to different thresholds being used – but they do follow the same overall graph line.
Improvements
I would definitely like to try to make the bubble detection far more resilient against other noises. If anyone has any suggestions, I’d be keen to hear.
It could be interesting to try different chunk sizes, especially for the envelope method. I think using a chunk size less than 512 samples could potentially help increase accuracy at the expense of increasing processing required.
Currently the threshold for either the FFT approach or envelope approach, can dramatically alter the number of bubbles / minute counts (although the shape of the graph will remain similar). It would be useful to devise a mechanism to choose the optimal threshold value.
I’m wondering if sampling at substantially higher than 48kHz, could enable individual bubbles to be detected, I’d be curious to hear your views on that and whether a higher sample rate is necessary to do that.
Why not use an optical sensor?
I was curious if I could count the bubbles via audio, but an optical sensor approach looks like it works very well:
https://www.sparkfun.com/tutorials/131 – This is an excellent example of using an optical sensor. Interestingly I seem to get the same ‘dip’ in bubble production, near the start of the graph.
It could also be interesting to use a camera, to image the bubbles and perform some kind of edge detection and blob recognition.
Issues
I now have 57 GB of audio files of bubbles, which does somewhat limit the usefulness of my approach 😉 It would be much better to process the audio in realtime and then only record bubble information, but I developed the algorithm after recording the audio and having raw audio does enable me to tweak the algorithm later.
Sourcecode
https://github.com/anfractuosity/bubbleometer
Leave Comment
Error