
The idea of this project is to image the refractometer output, then convert the position of the blue line, to a digital reading, using image processing.
The idea is to measure the brix of wort during mash and sparging, so that sparging can be stopped around 1.010 SG, to avoid tannins.
It was necessary to alter /boot/config.txt, so that the temperature probe was recognised. Also without gpiopin=4, the probe didn’t seem to be detected on my Pi Zero W.
dtoverlay=w1-gpio,gpiopin=4
disable_camera_led=1
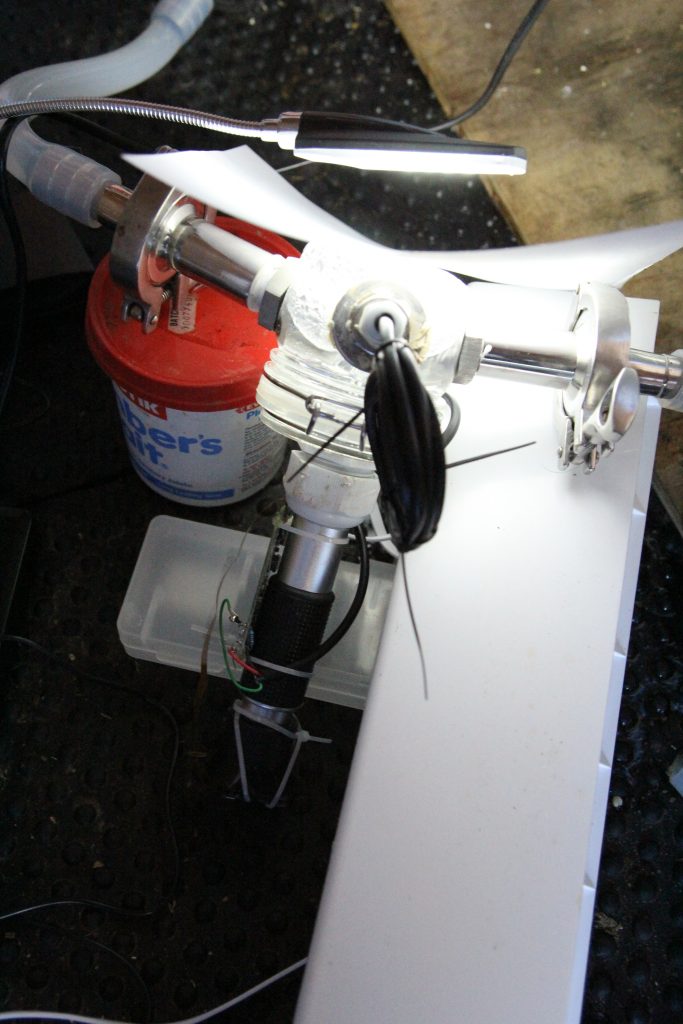
The following image depicts a Pi zero with a camera along with a thermowell with a DS18B20 temperature probe, also connected to the Pi.
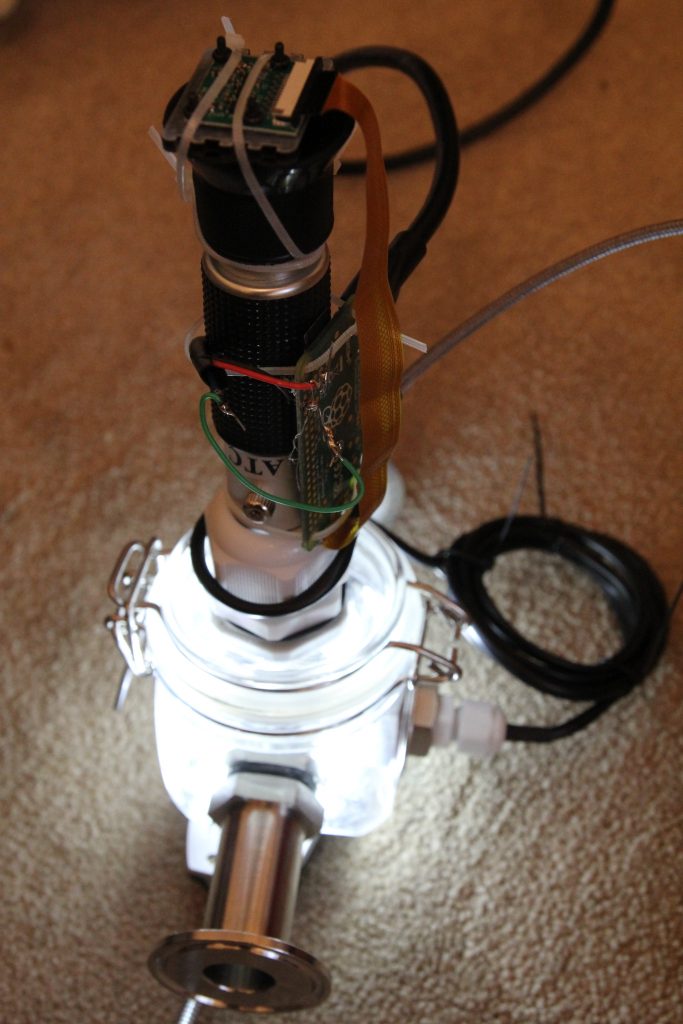
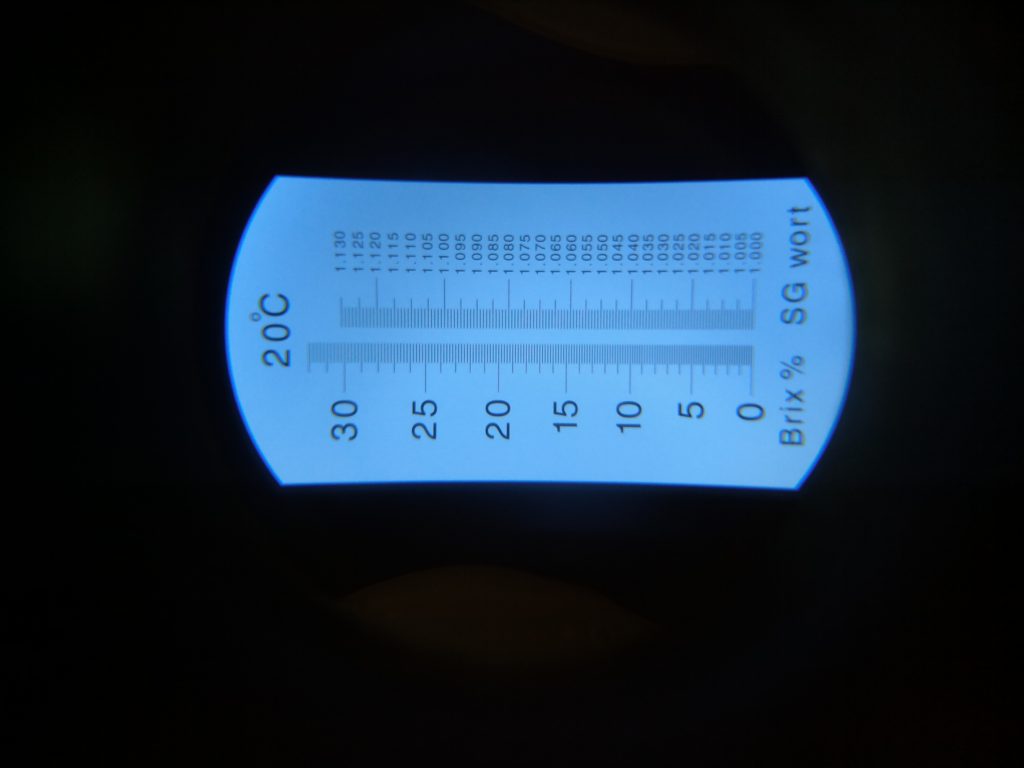
Image from the refractometer taken via the Pi camera, without any liquid in the vessel.
The following video depicts water being recirculated through the refractometer being heated from around 17C to just below 70C, before the raspberry pi crashed, I believe being in too close proximity to the hot refractometer (Note: The camera is now separate from the refractometer body, so this shouldn’t happen).
The idea of heating just plain water, is so that I can generate a calibration curve for brix as temperature increases.
As you can see from the video I need to alter the shutter speed of the pi camera, as the images become too dark at high temperatures.
Version 1
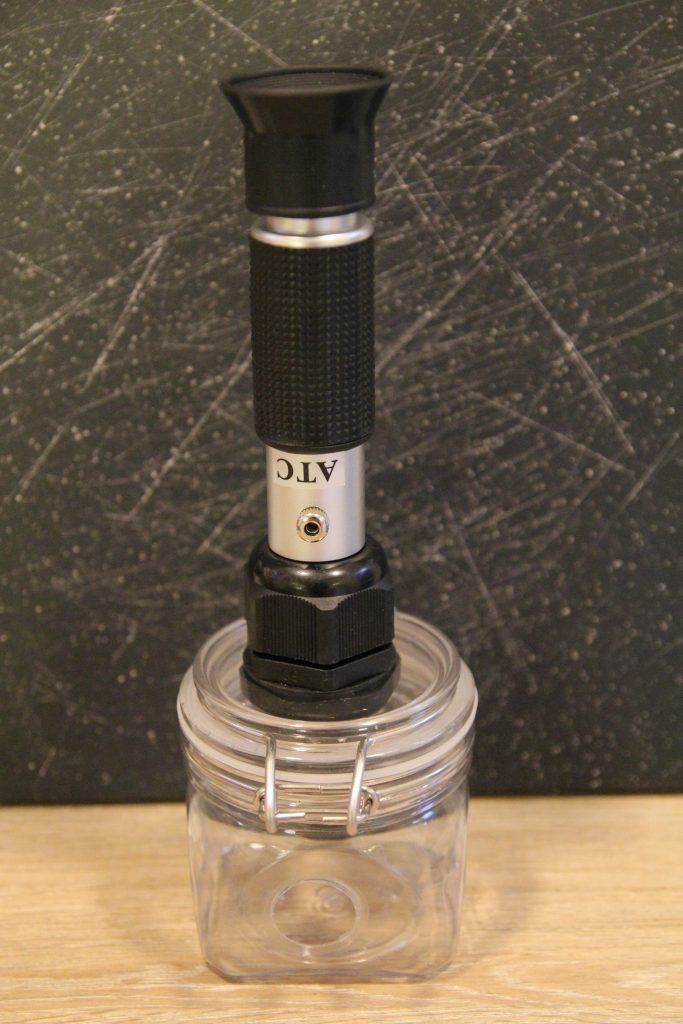
Image of the first test, using a piece of paper as a diffuser and clumsily balanced on a tub to get the right angle for the liquid to fill most of the vessel. Note the photo below was taken just after the experiment, and the water in the vessel has dropped what looks like below the thermowell.
Version 2
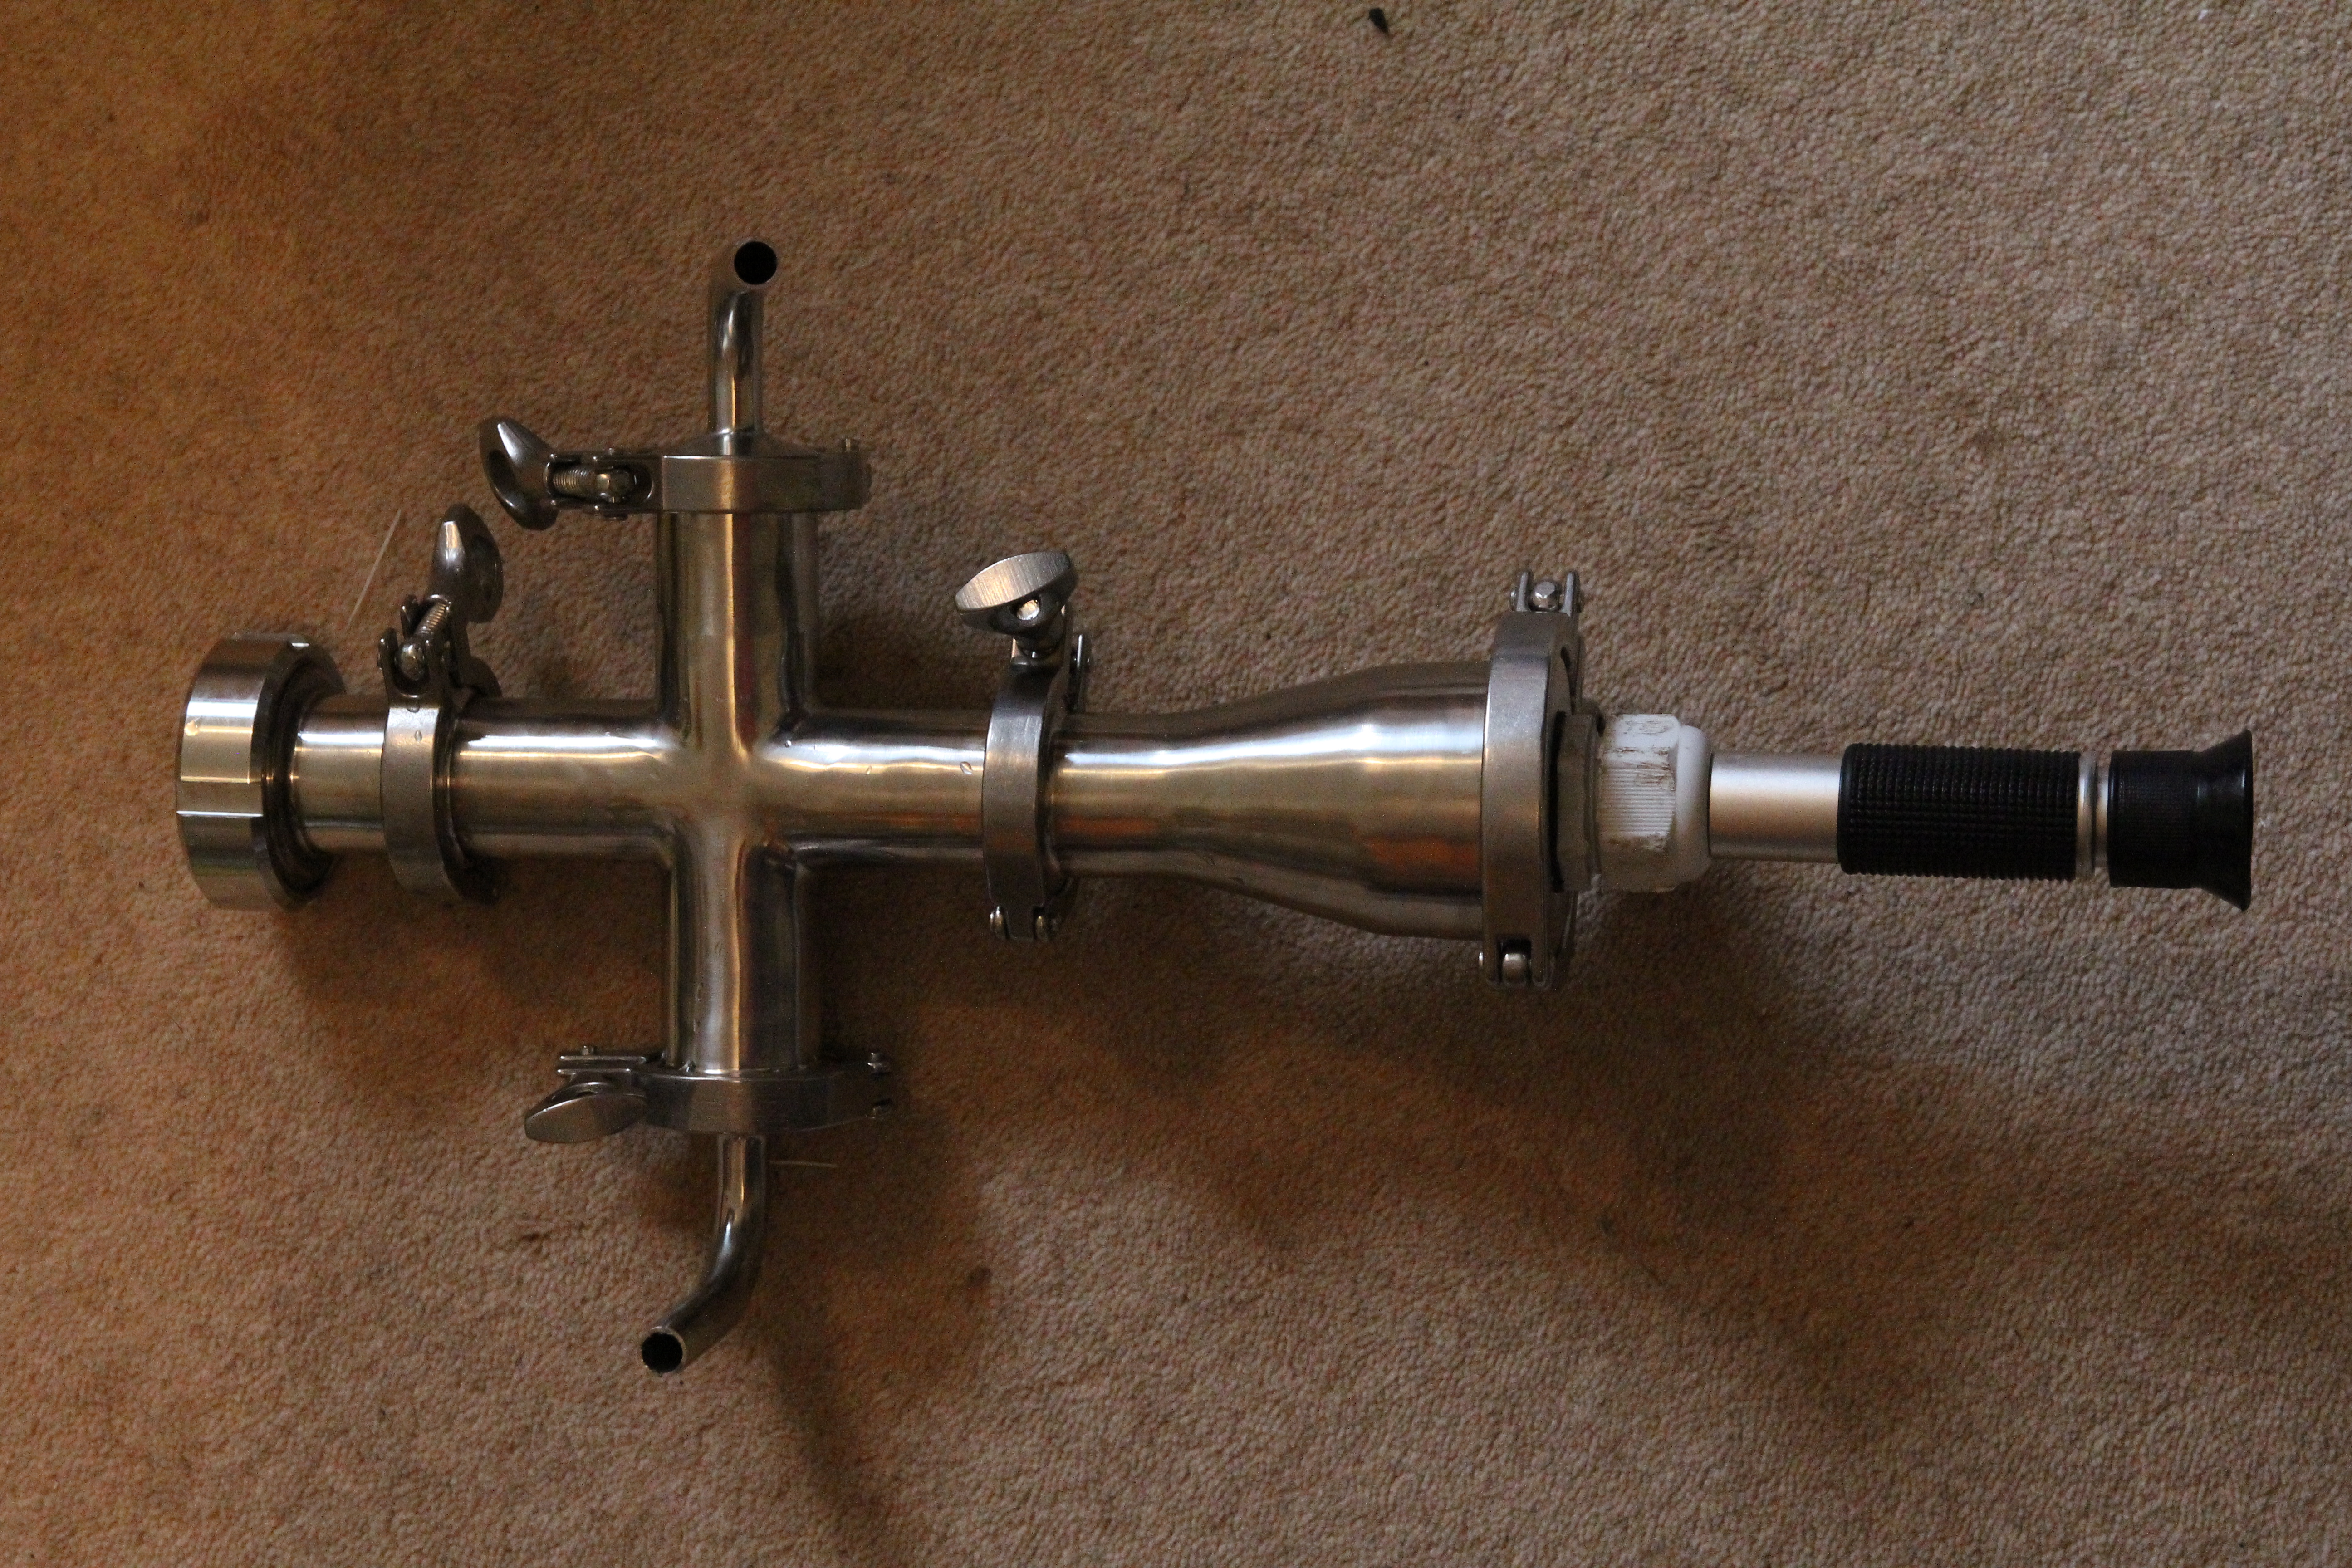
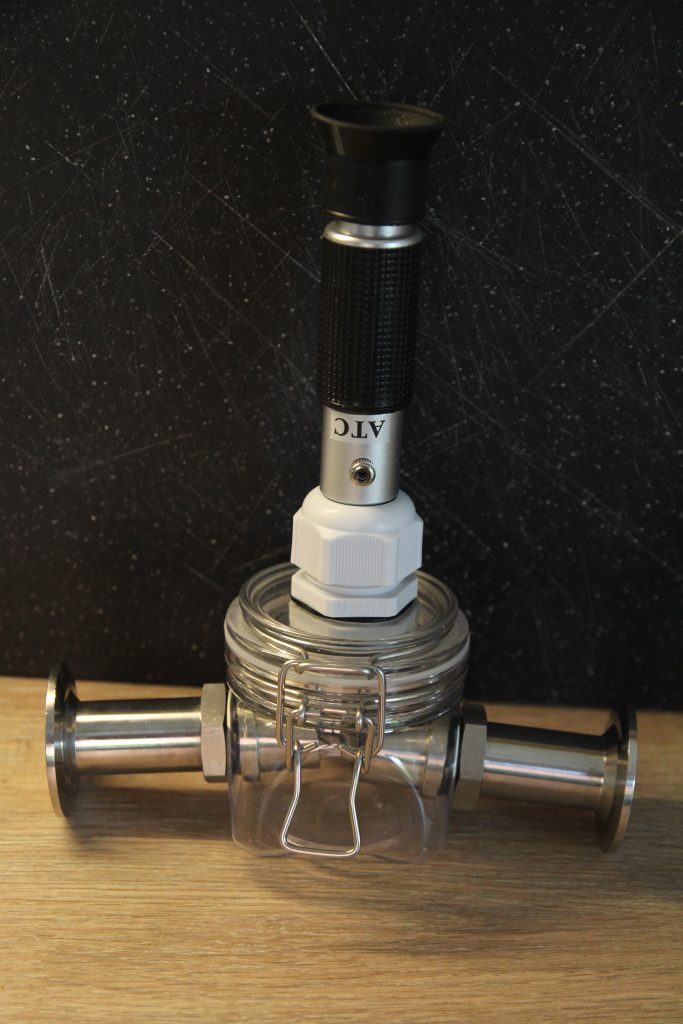
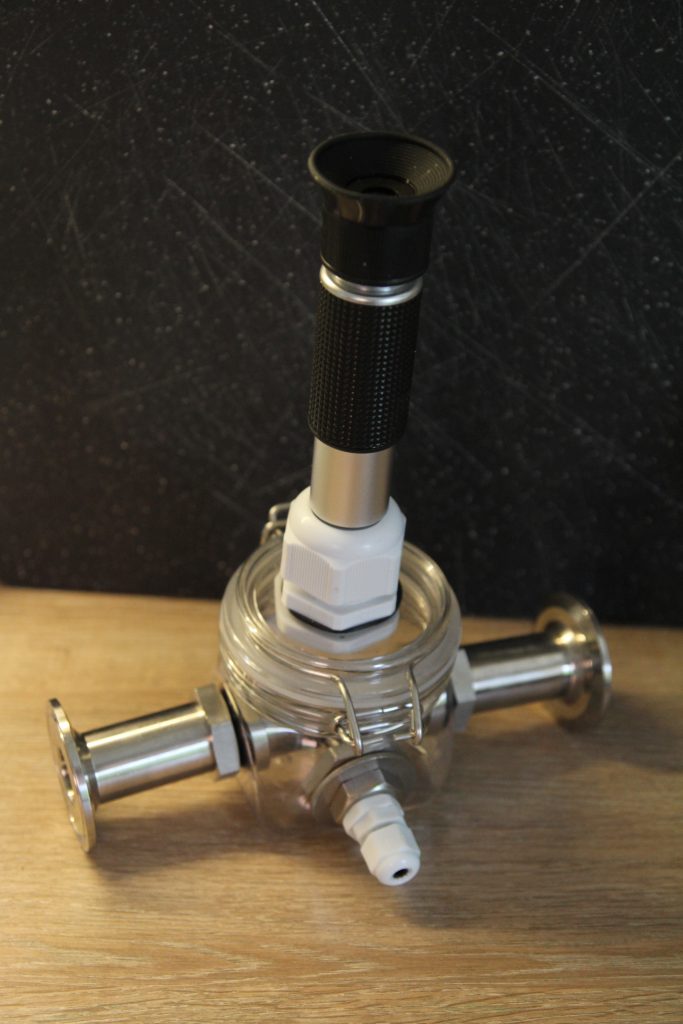
I had problems with the triclamp version I was working on, I believe possibly because not enough light was getting in from all angles.
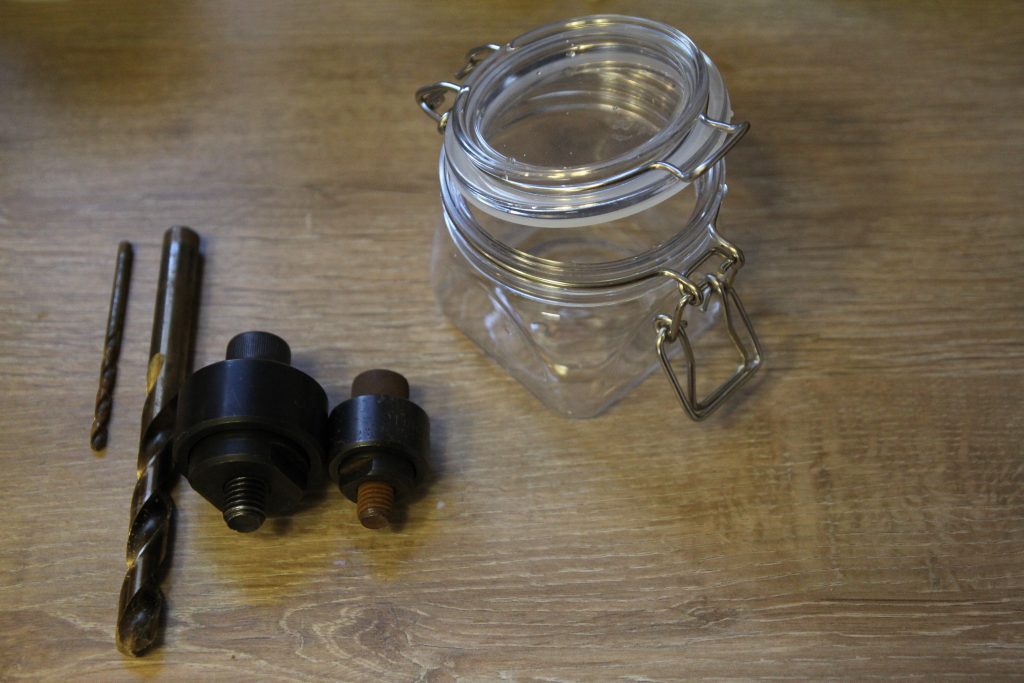
Version 3 (2020)
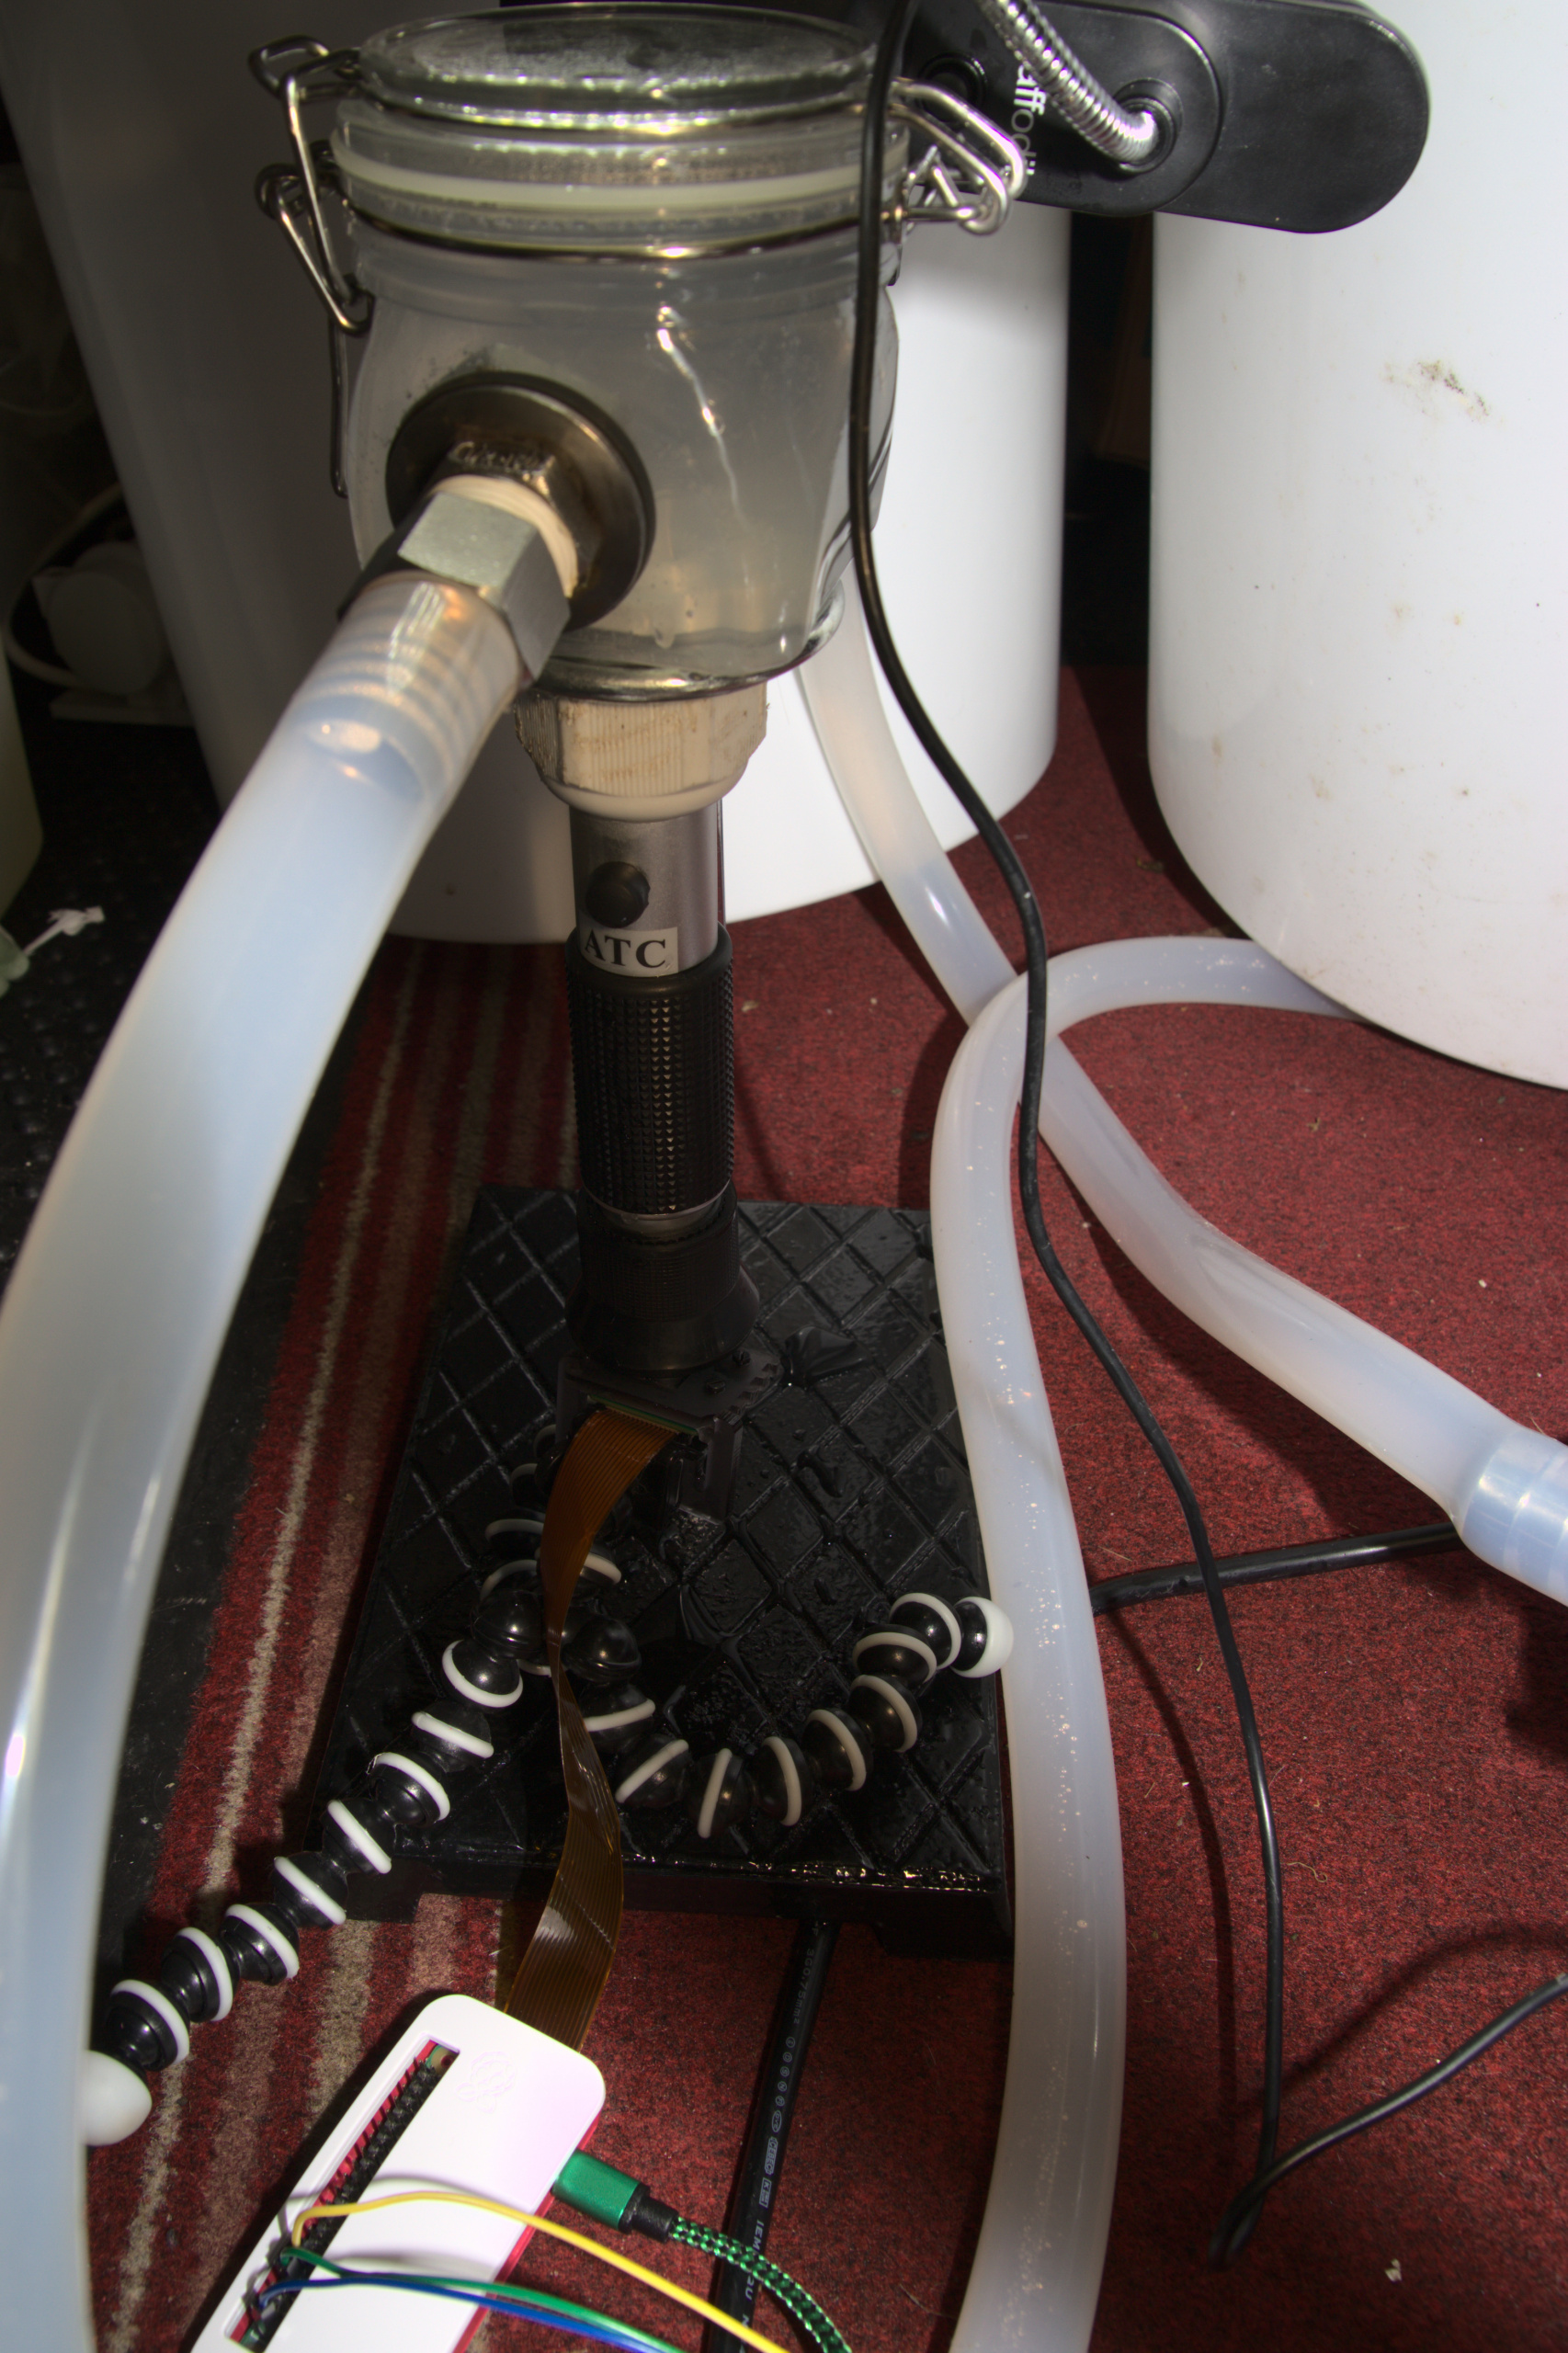
The following image depicts a new version, making use of a lab clamp to hold the jar. The camera is now positioned on a mini tripod.
I recorded images every second from the refractometer whilst heating the water being pumped through it. I took two photos to create a simple line graph, with the following values:
| Pixels from top of scale to line | Temperature | Real Brix |
| 1170 | 22.31C | 0 |
| 1332 | 70.19C | 0 |
Using this information I obtained an equation for the line, which allowed me to perform temperature correction for different temperatures.
I created a very simple python snippet that I then used to obtain a ‘real’ brix value when I added powdered sugar to the water.
current_temp = 70.31
current_diff_from_top_scale = 1284
scale_height = 1170

def temp_correction(temp):
    return 3.383*temp + 1094.515

print((1 - ((current_diff_from_top_scale - (temp_correction(current_temp) - scale_height)) / scale_height)) * 32)
This gave me a value of 1.32 brix whilst my digital refractometer read 1.4 brix.
https://github.com/anfractuosity/refractometer – the software to capture images and log temperature data to a CSV file, is located here.
You can see my article in the BYO Magazine – https://byo.com/ (Jan/Feb 2021) for further information on this version.
My first attempt at tracking the refractometer brix line automatically (you can see it doesn’t always find the line exactly, so this needs to be improved):
To Do
- Investigate different plastics which may be more suitable for high temperatures (less potential for warping)
- Finish working on software to automatically determine the brix from the photo
- Then use many photos for the generation of a graph of the temperature and ‘apparent’ brix, so that a more accurate calibration curve can be created.
Joel
Well, that’s a first as far as I can tell. Good work.
Justin
Great idea, thanks for posting it! I am interested in building something similar and have a couple questions.
1. Did you remove the prism housing (the angled part) or does it sit in the fitting?
2.What kind of fitting did you use?
admin
Hi, thanks, I just used the whole refractometer for both the triclamp metal version and version with the plastic jar.
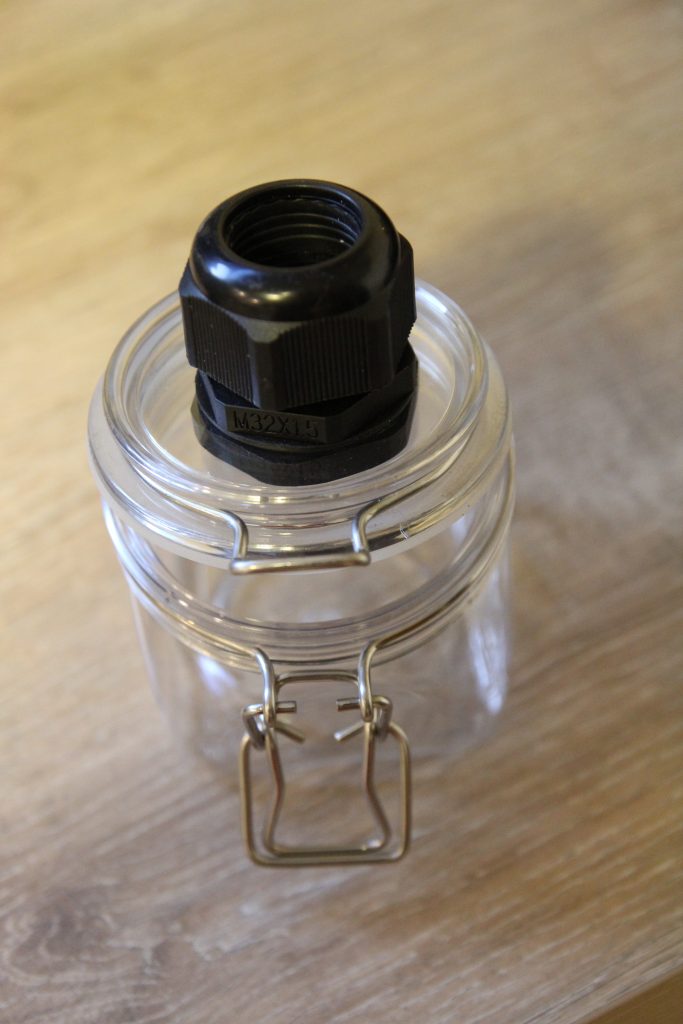
For the plastic jar version, I used a cable gland fitting.
For the triclamp version, I had a metal triclamp ferrule milled out (but this version didn’t seem to give very clear pictures, because not enough light was getting in I think).
Hope that helps.
Joel
This is great. I am looking to make something like this.
Why didn’t you use a digital refractometer?
Wouldn’t it be easy to read the data from it?
admin
Yes that’s a good point regarding a digital refractometer. I have got one of those,
but didn’t really want to take it apart to use it ‘in-line’.
Stefano
Good idea ! Have you build a stable version of this project for everyday use ?
Have you processed the images for reading the measure ?
I hope you ansewr me !
admin
Hi, I’m back working on this project again, hopefully I’ll be able to post an update soon!
AdrienM
Interesting project, but I’m curious why you created a calibration curve when you are using a refractometer with ATC.
Also, I’ve found the light angle that gives the most contrast is when the source is directly opposite the eyepiece. (as if you are looking through a tube without the prism directly into the light. You can test this in a dark room with an LED flashlight. (which also might work better than the ‘bank light’ you are using for the project as it has a more focused beam, and might also help improve the Tri-Clamp version)
Can’t wait for the next update!
admin
Thanks for your comment. As I understand ATC only helps correct for small temperature changes.
I think the refractometer is designed for temperatures around 20C, whereas I’m testing at some points > 50C.